Bitcoin Price Analysis: Navigating Market Volatility This Week
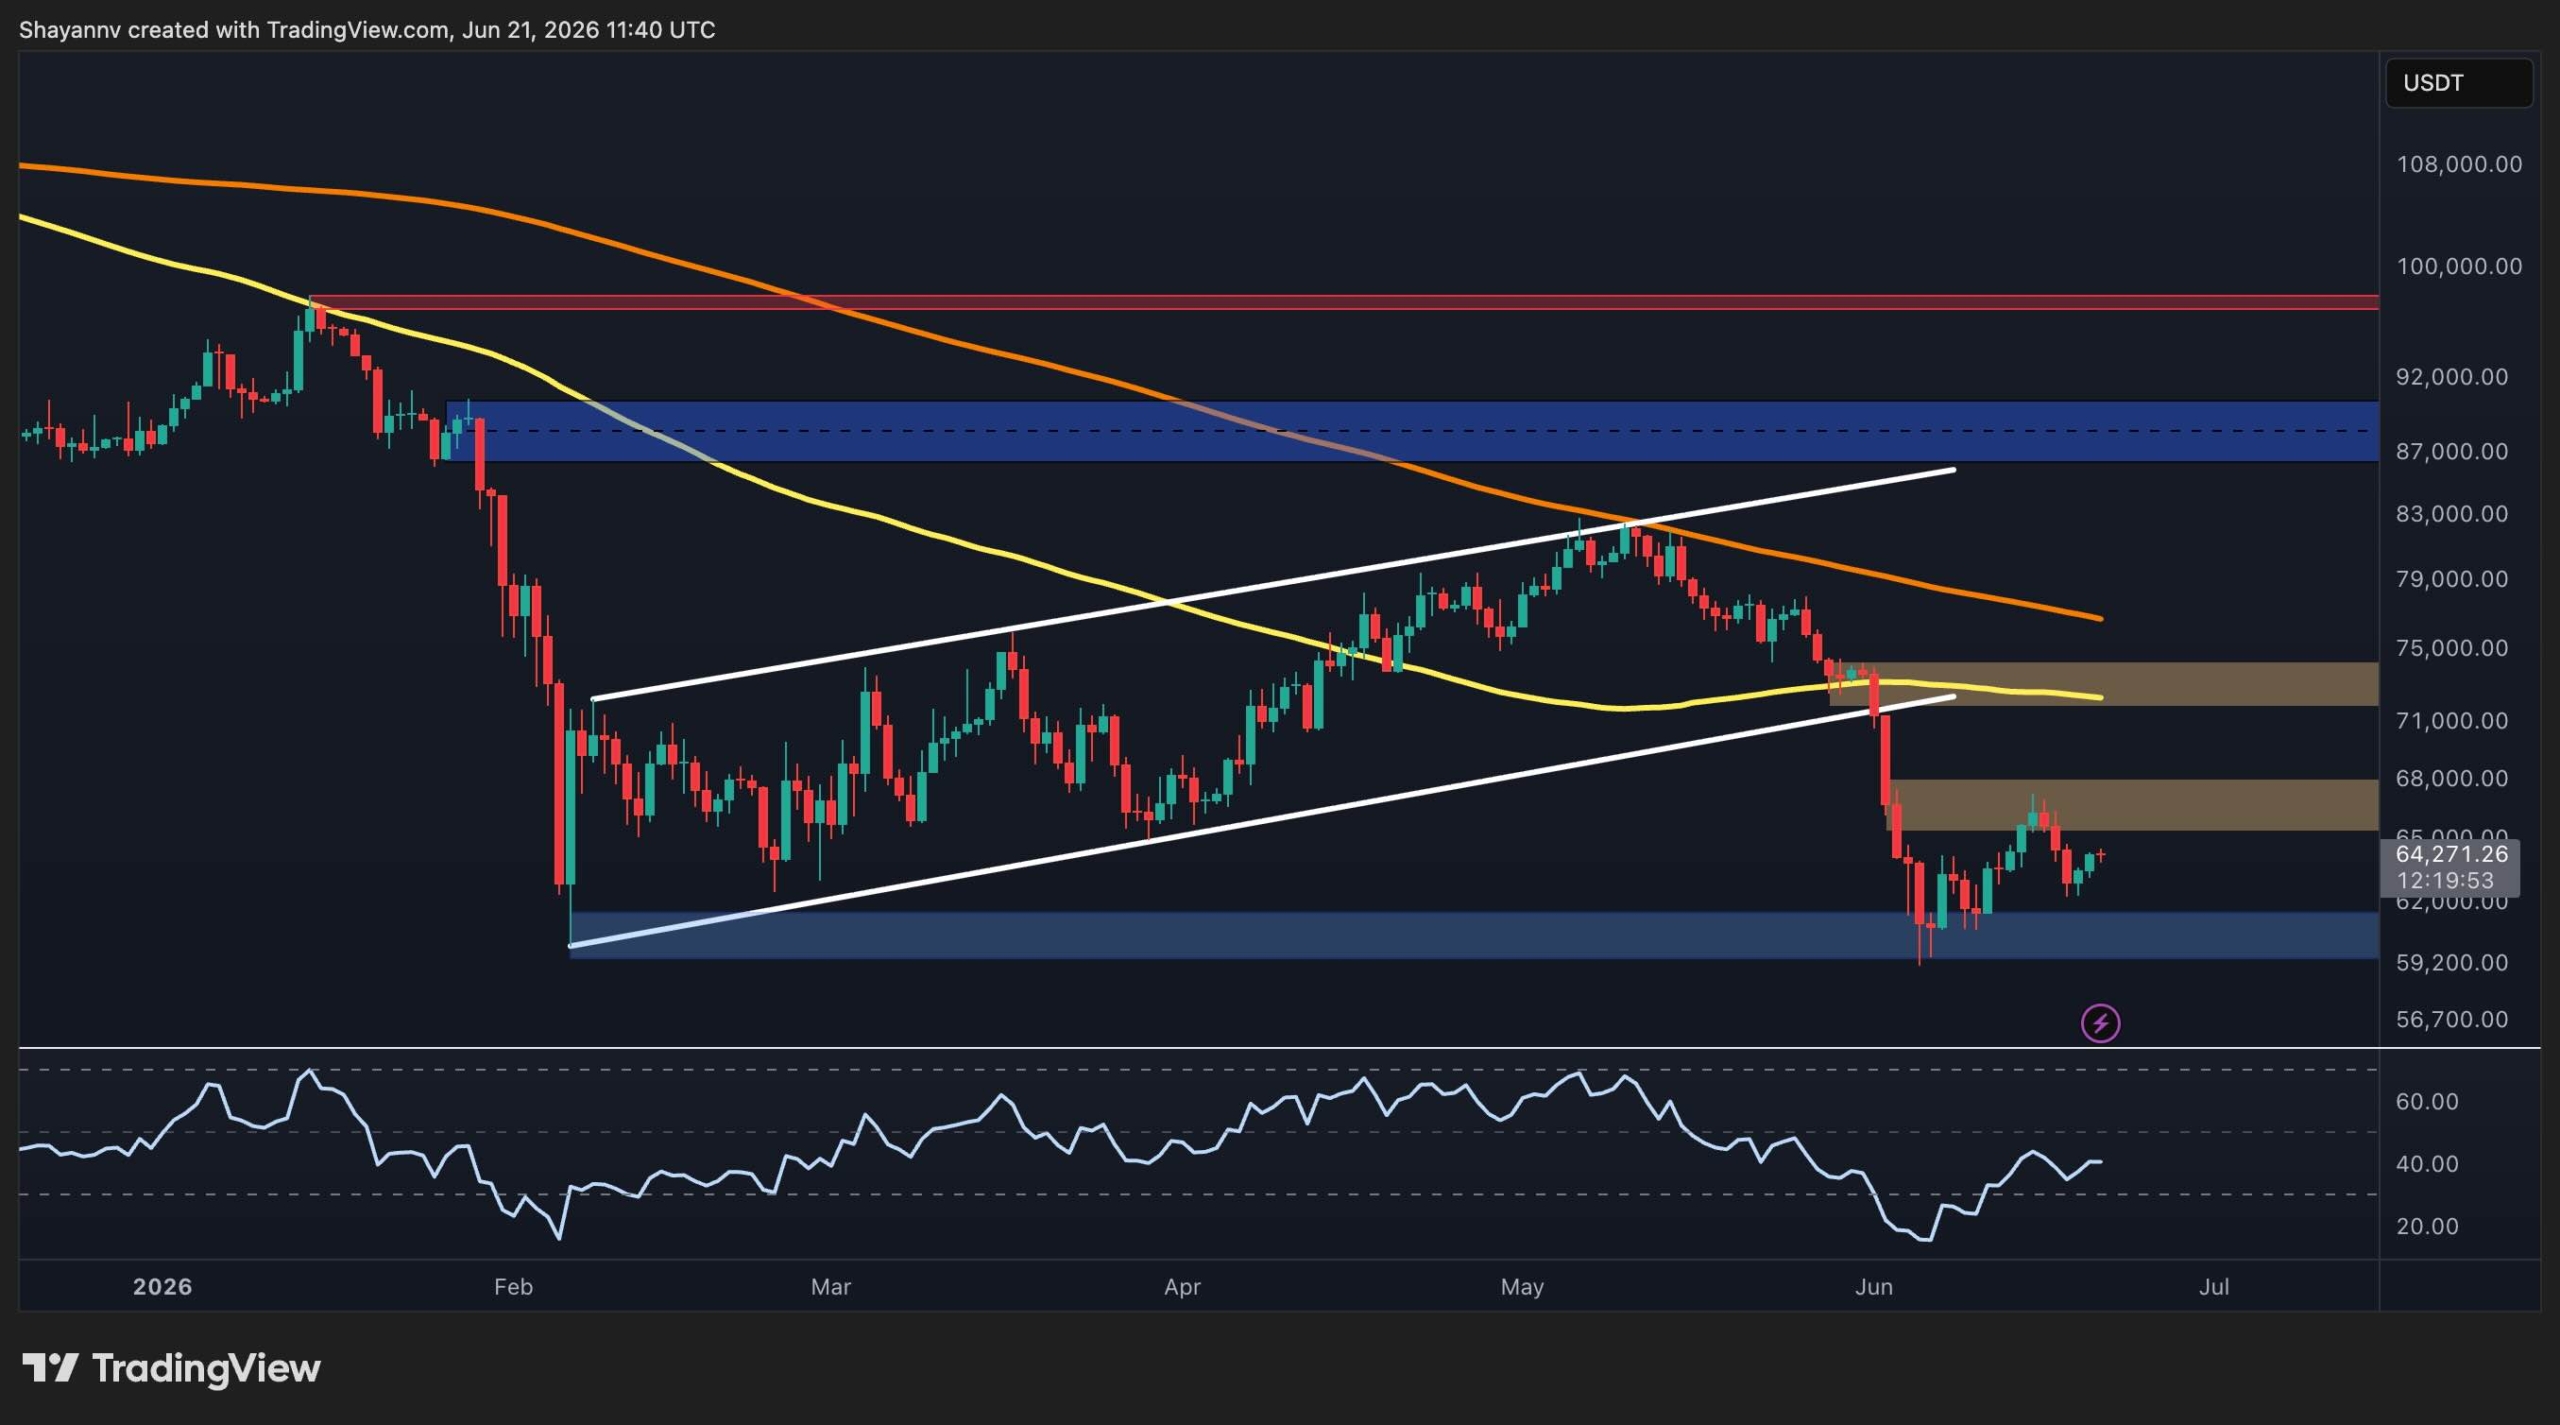
Bitcoin (BTC), the world's first and largest digital currency, is currently facing significant selling pressure after a decisive breakdown from its multi-month rising channel (a pattern where prices move upward between two parallel lines). This week, market analysts are closely watching the $60,000 support level—a price point where buying interest is strong enough to stop a decline—to see if the digital asset can sustain a recovery. While a short-term rebound occurred recently, the overall market trend remains cautious as investors wait for Bitcoin to reclaim key resistance levels (price ceilings that are difficult to break above).
The Technical Landscape for BTC Holders
Technical analysis on the daily chart shows that Bitcoin's recent price action has shifted the power dynamic toward sellers. For months, Bitcoin traded within a predictable upward range, but breaking below the lower boundary of that range suggests a change in sentiment. Currently, the most critical battleground is the $60,000 psychological mark. If the price stays above this level, it signals that buyers are still willing to accumulate the asset. However, if Bitcoin fails to climb back above its previous support-turned-resistance zones, we could see further downward movement toward the $58,000 or even $55,000 range in the coming days.
Understanding Resistance and Support Levels
In the world of cryptocurrency, support and resistance act like the floor and ceiling of a room. Right now, Bitcoin is trying to push back through the floor it just fell through. Analysts are specifically looking at the 50-day moving average (an indicator that shows the average price over the last 50 days) as a hurdle. To regain a bullish or positive outlook, Bitcoin needs a daily close above $64,000. Until that happens, the 'path of least resistance' seems to be sideways or slightly downward. Traders often use the Relative Strength Index or RSI ( a tool used to measure if an asset is overbought or oversold) to predict these movements, and currently, it shows a neutral but fragile state.
What This Means for USA Investors
For investors in the United States, this period of volatility highlights the importance of 'dollar-cost averaging' (investing a fixed amount of money at regular intervals regardless of the price). With Bitcoin hovering near the $60,000 mark, long-term holders may see this as a potential entry point, while short-term traders might want to wait for a confirmed trend reversal before entering new positions. It is also essential to keep an eye on U.S. economic data, such as inflation reports, which often influence how institutional investors treat 'risk-on' assets like crypto. Always remember that the crypto market operates 24/7 and can be influenced by global events over the weekend.
Source: CryptoPotato