Ethereum Price Analysis: Technical Recovery Meets Market Resistance
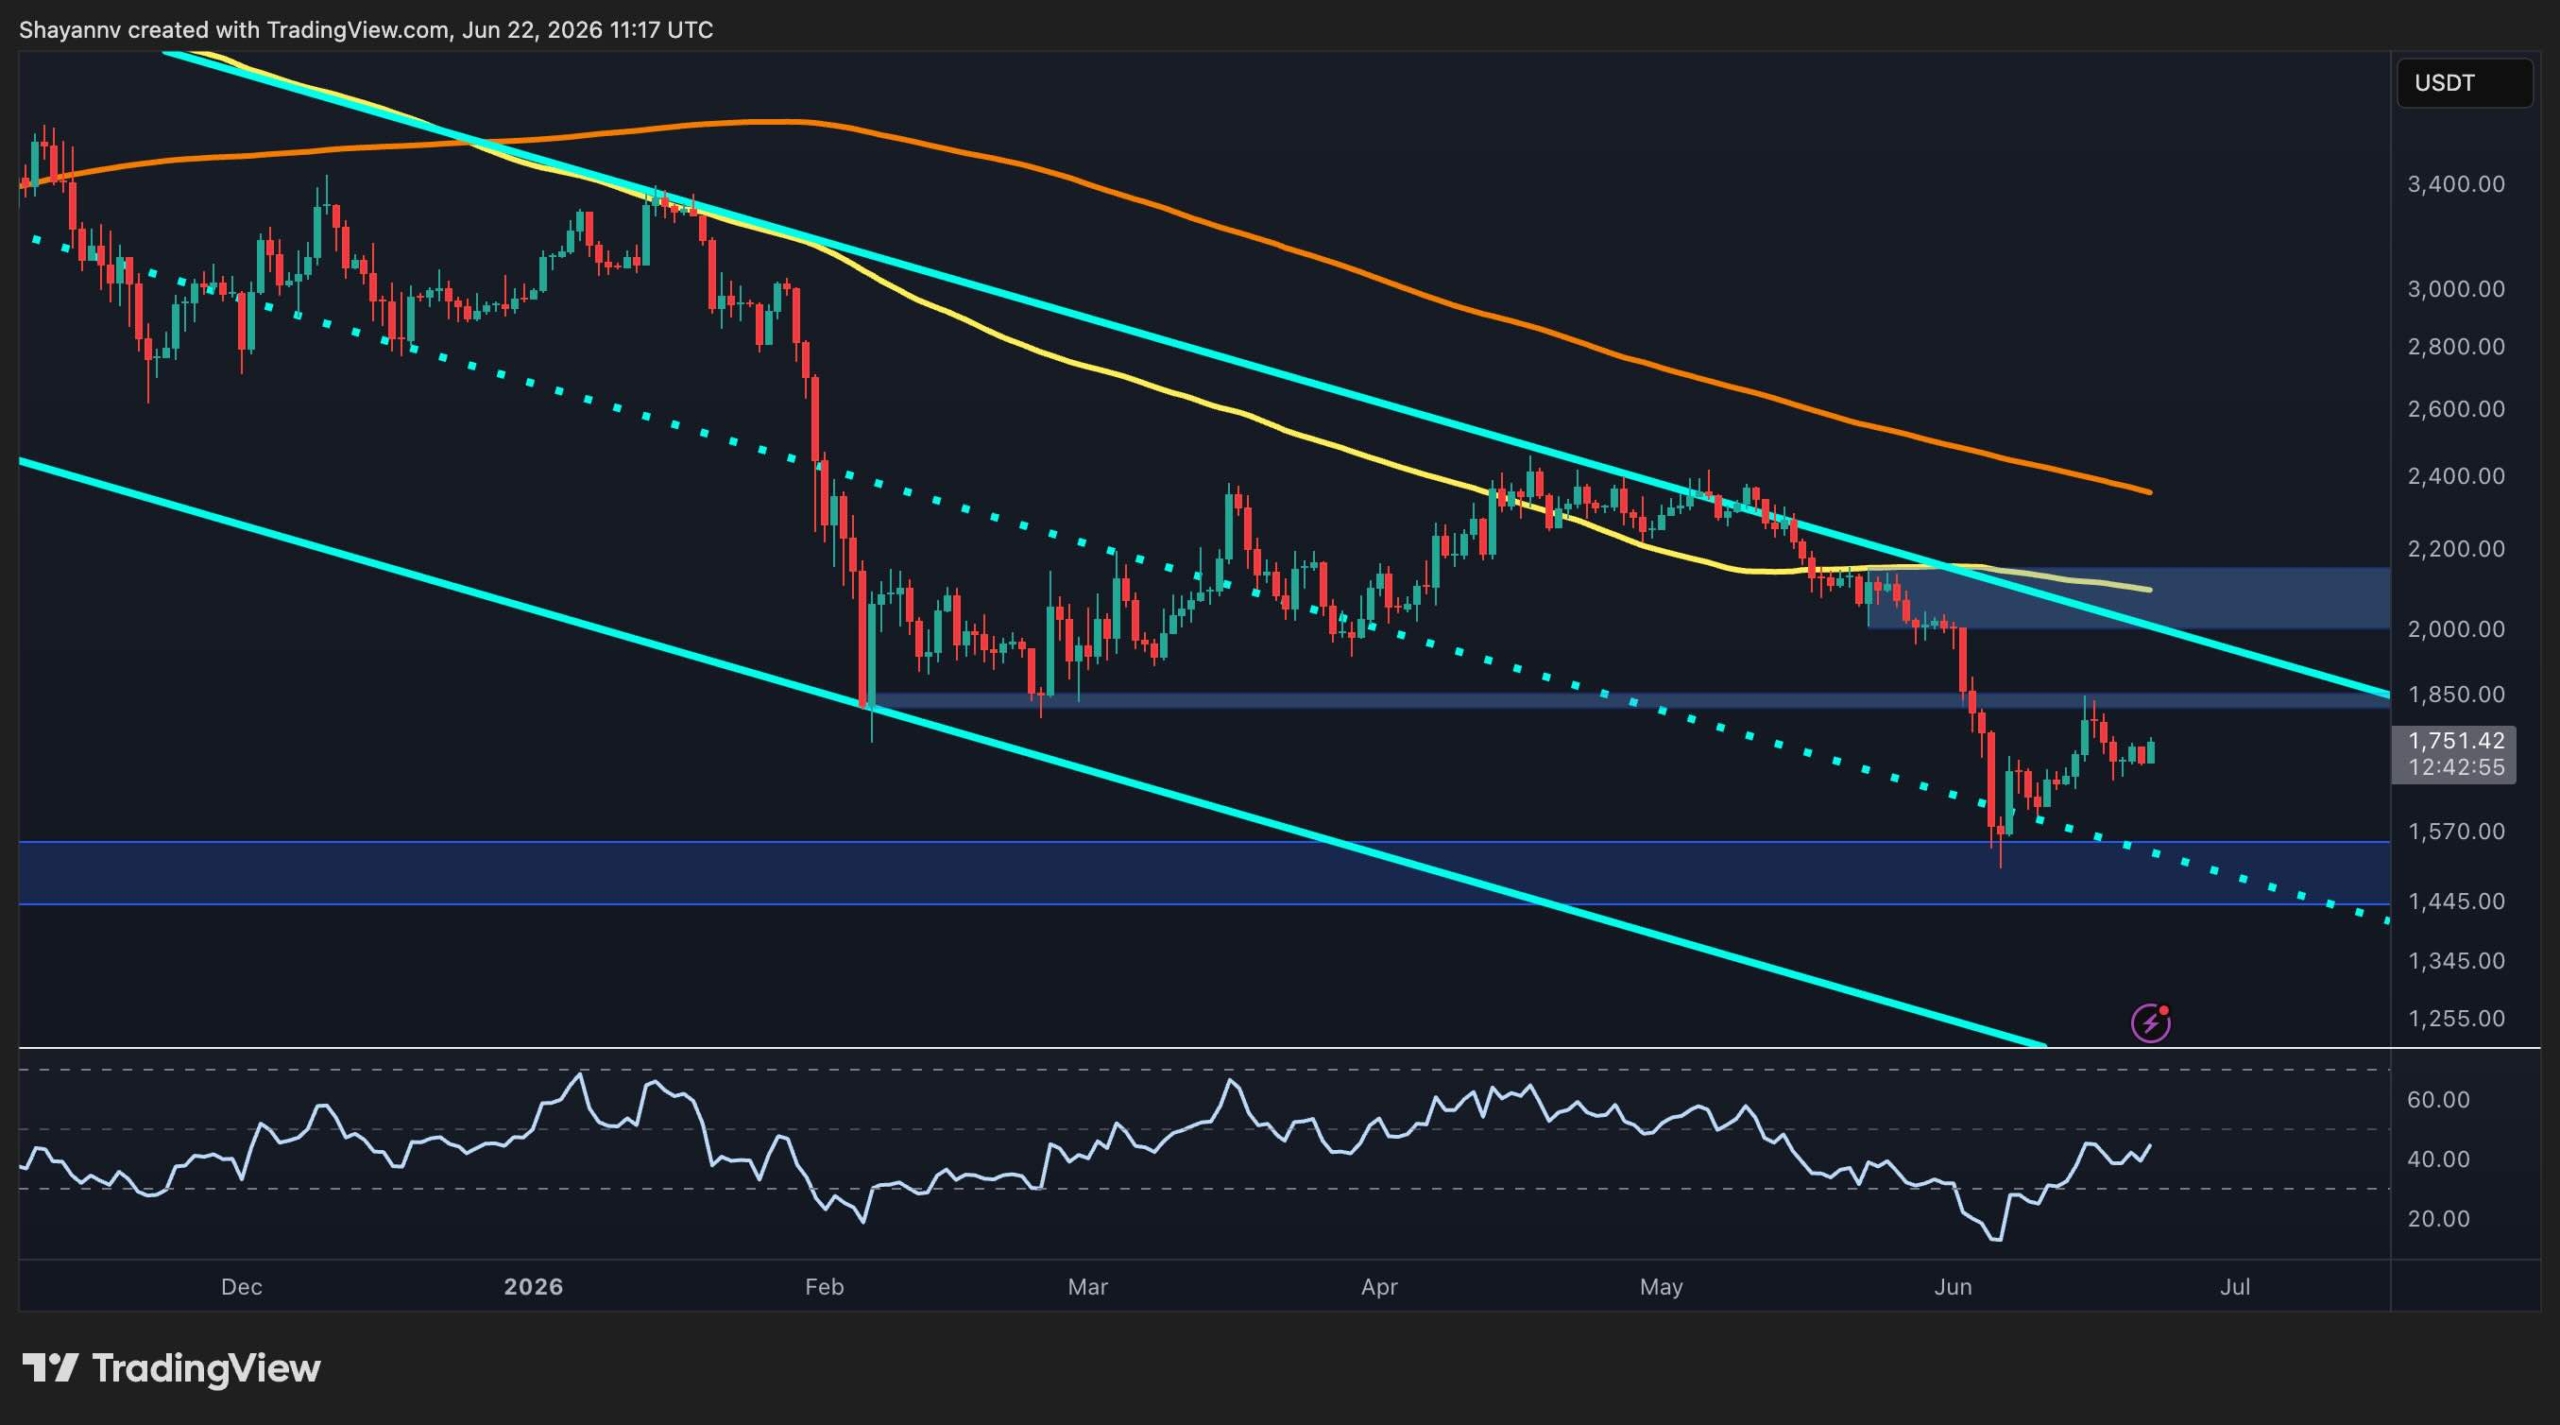
Ethereum (ETH), the world's second-largest cryptocurrency, is showing signs of a technical comeback this month after a sharp price drop saw it touch the $1,500 level. Traders and analysts are watching closely as buyers defend key demand zones (price areas where many investors want to buy) to prevent further losses. While the short-term outlook is improving, the overall market remains cautious due to broader economic factors and historical price hurdles that have yet to be cleared.
Understanding the Ethereum Resistance and Demand
For a beginner, it is helpful to look at Ethereum as a battle between bulls (investors who think prices will go up) and bears (investors who think prices will fall). Recently, the 'bulls' successfully protected a major demand zone near $1,500. This protection led to a small bounce in price, but the 'bears' still control the higher timeframe. This means that while the price is up today, the long-term trend over several months still shows lower peaks. To truly turn bullish, Ethereum needs to break through its resistance levels (price points where selling pressure usually stops a rally).
Technical analysis often looks at derivatives (financial contracts that get their value from an underlying asset like ETH). Current data from these markets shows that buying interest is slowly returning. However, for a sustained rally, Ethereum must stay above its daily moving averages. Moving averages are simple tools that smooth out price data to tell us the average price over a specific number of days, helping traders identify the actual trend direction amidst daily price noise.
The Role of Market Sentiment and Volume
Price alone does not tell the full story. Volume (the total amount of ETH traded in a specific timeframe) must increase to confirm that this recovery is real. If the price goes up on low volume, it suggests that not many people are participating, which often leads to a quick reversal. Currently, the technical aspects are 'quietly improving,' which means the charts look better even if the public is not yet excited. This slow improvement can sometimes lead to a 'breakout' where the price suddenly surges past previous limits.
Investors are also keeping an eye on the broader crypto market. Since Bitcoin often leads the way, Ethereum’s recovery is partly dependent on Bitcoin staying stable. If Bitcoin falls, Ethereum usually follows, regardless of how strong its individual technical charts look. This connection is why many experienced traders look at the 'ETH/BTC' pair to see if Ethereum is gaining strength against the market leader.
What This Means for USA Investors
For investors in the United States, the current price action suggests a period of consolidation. This means the price is moving sideways rather than straight up or down. For those using a Dollar Cost Averaging (DCA) strategy—buying a fixed dollar amount of crypto at regular intervals regardless of price—the defense of the $1,500 level provides some comfort that a 'floor' may be forming. However, with the SEC (Securities and Exchange Commission) continuing to clarify rules around digital assets, US investors should remain aware that regulatory news can cause price volatility (rapid and unpredictable changes) faster than any technical chart pattern.
While the technicals are improving, it is wise to monitor the macro-economic environment in the US, such as inflation data and interest rate hikes, which often dictate how much 'risk' investors are willing to take on assets like Ethereum.
Source: CryptoPotato